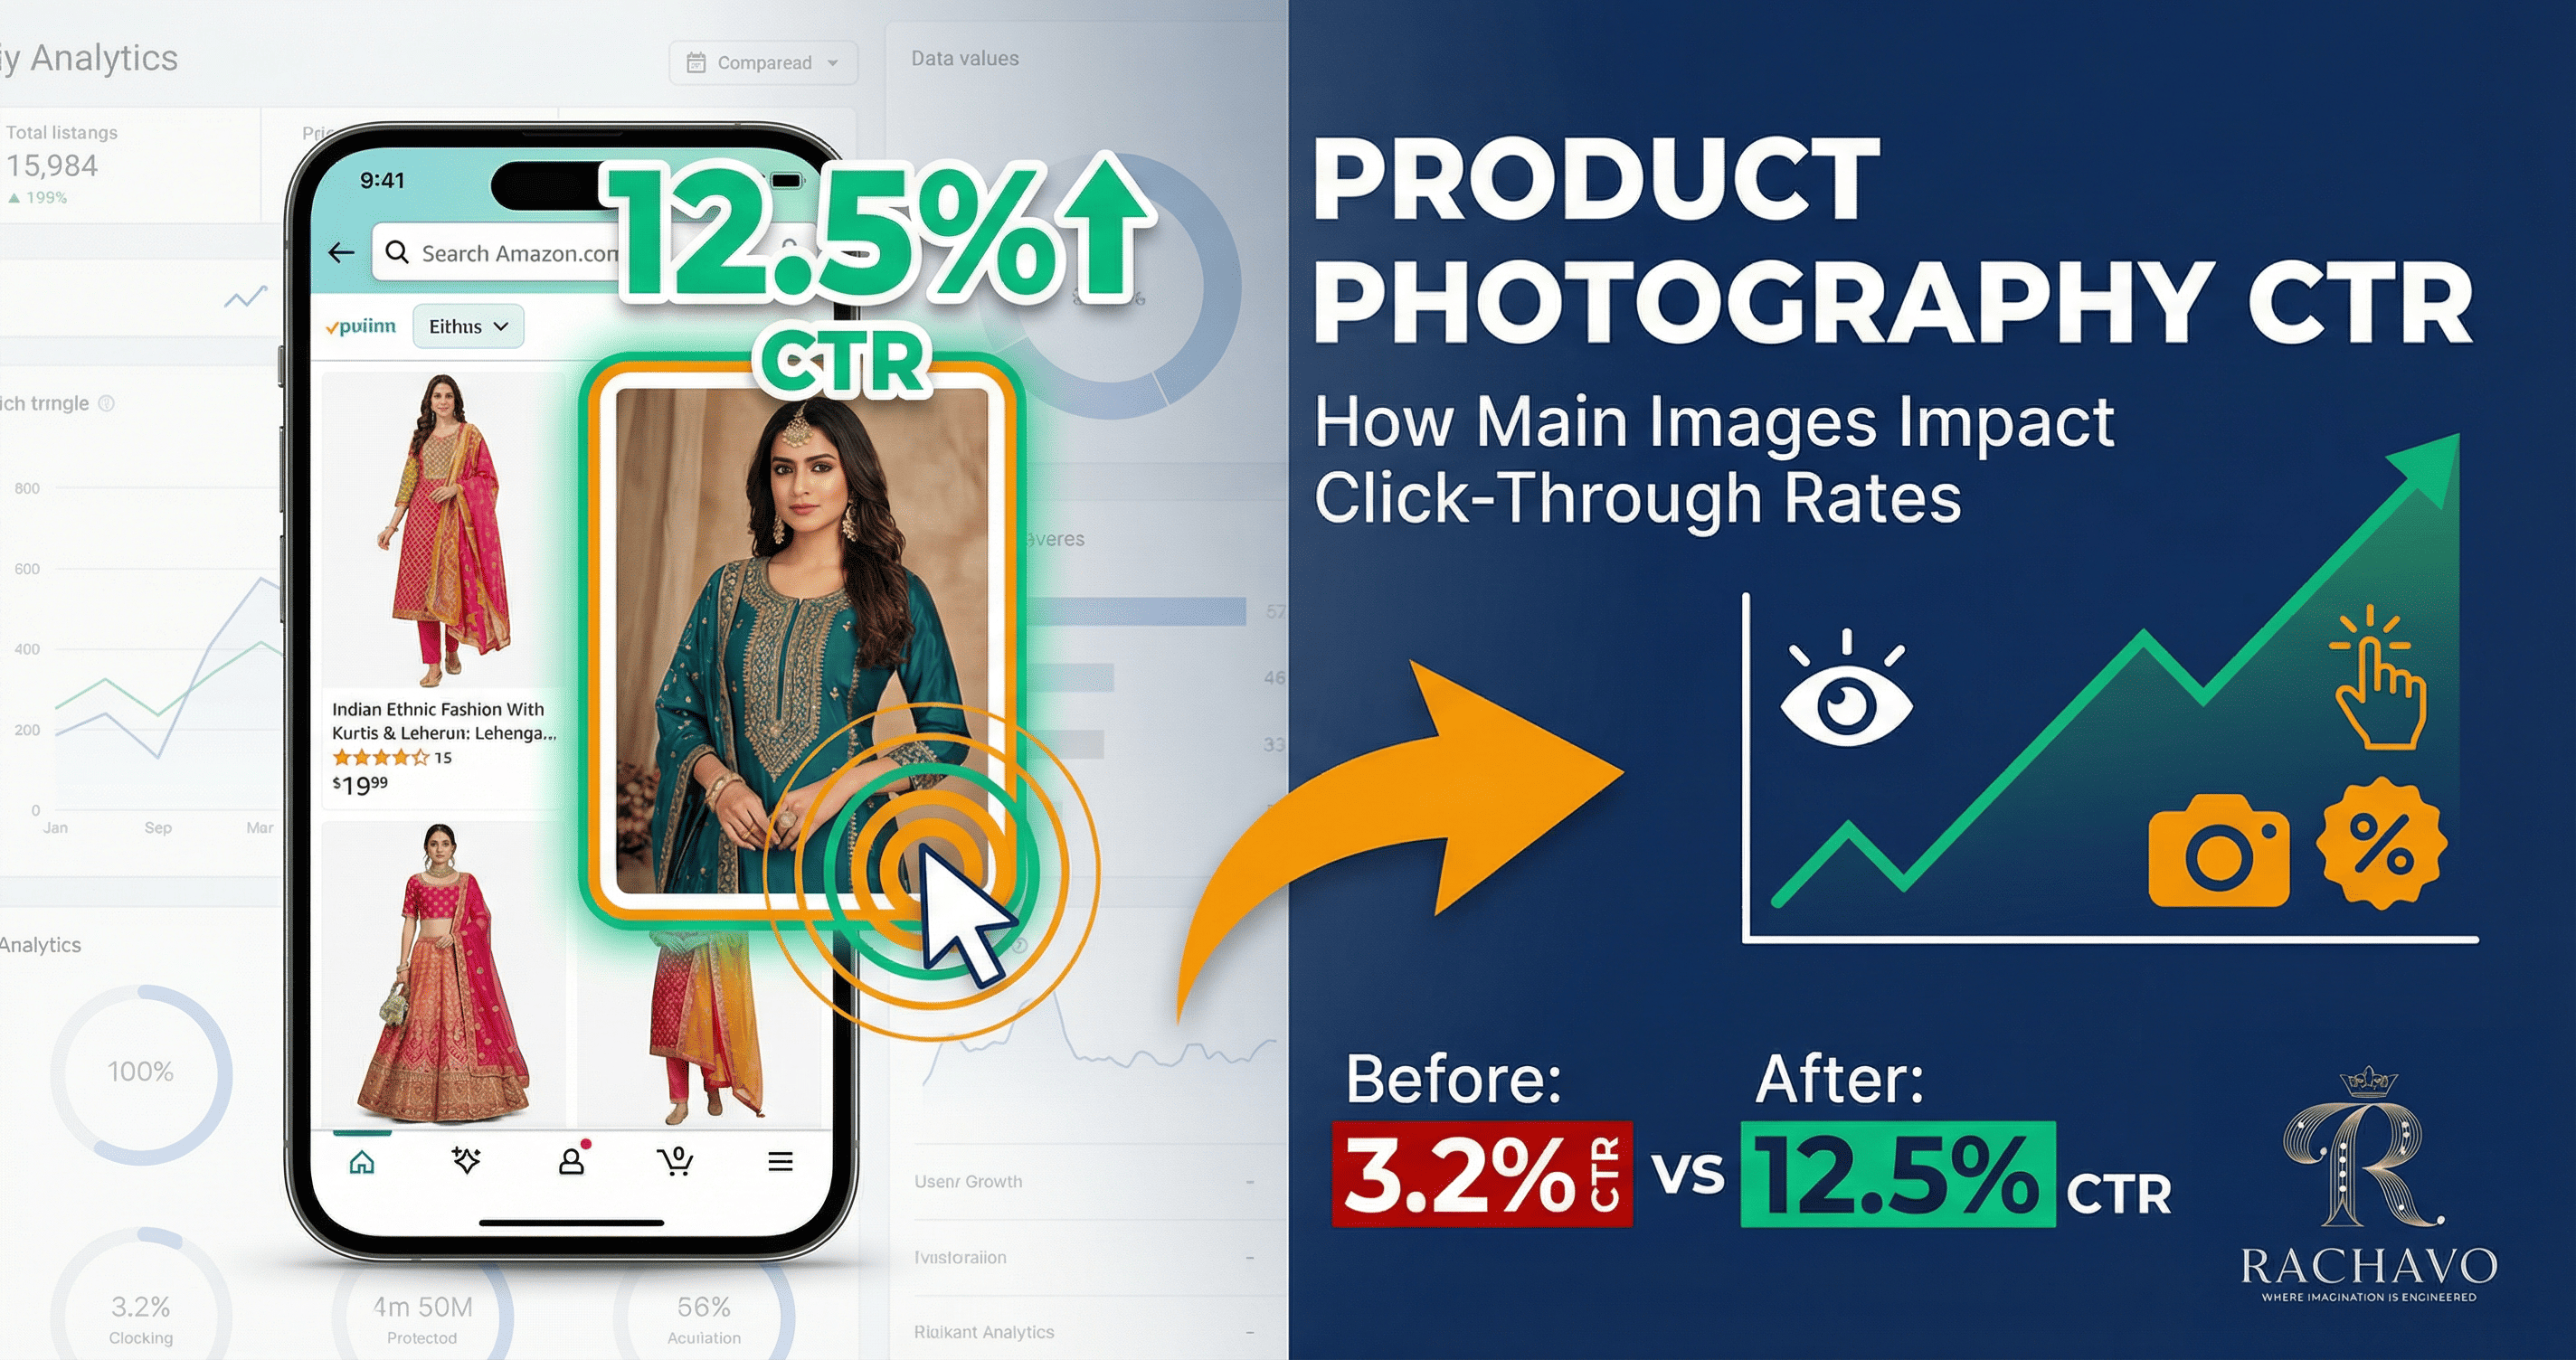
Product Photography CTR: How Main Images Impact Click-Through Rates
📑 Table of Contents
- What is Product Photography CTR?
- Why CTR Matters More Than You Think
- The Data: How Images Impact Click-Through Rates
- 7 Image Elements That Increase CTR
- CTR Killers: What Makes Shoppers Scroll Past
- Platform-Specific CTR Optimization
- How to A/B Test Your Product Images
- Mobile vs Desktop CTR Differences
- CTR Benchmarks for Fashion Categories
- Conclusion
What is Product Photography CTR?
Click-Through Rate (CTR) measures how often people click on your product listing after seeing it in search results.
The Formula:
CTR = (Clicks on Your Listing / Impressions) × 100
Example:
- Your product appears in search results 1,000 times (impressions)
- 85 people click on it (clicks)
- Your CTR = (85 / 1,000) × 100 = 8.5%
Why Your Main Image Dominates CTR
When shoppers browse search results, they see:
- Product image (70% of visual space)
- Product title (often truncated on mobile)
- Price
- Ratings (if you have reviews)
Eye-tracking studies reveal:
- 84% of visual attention goes to the product image
- Shoppers evaluate images in 0.25-0.35 seconds
- Image quality influences 67% of click decisions
Your main image is the primary decision factor for whether someone clicks or scrolls past.
Why CTR Matters More Than You Think {#why-ctr-matters}
High CTR doesn't just mean more traffic—it creates a compounding advantage.
Direct Impact: More Qualified Traffic
Higher CTR = More Product Page Views
If you get 10,000 impressions monthly:
- At 3% CTR = 300 visitors
- At 9% CTR = 900 visitors
- That's 600 additional potential customers
Indirect Impact: Algorithm Boost
Amazon, Flipkart, and Meesho use CTR as a ranking signal:
1. Search Ranking Improvement
- Platforms interpret high CTR as relevance
- Your listing ranks higher for keywords
- Higher rankings = more impressions
- More impressions = more clicks (if CTR remains strong)
- Virtuous cycle begins
2. Ad Performance Enhancement
- Sponsored ads with higher CTR get better placement
- Lower cost-per-click (platforms reward engaging ads)
- Better ROAS (Return on Ad Spend)
3. Competitive Advantage
- Your listing appears above competitors with lower CTR
- You capture customers who would have gone to competitors
Real Business Impact
Case Study: Surat-based Kurti Seller
Before optimizing product images:
- CTR: 3.2%
- Monthly impressions: 15,000
- Monthly clicks: 480
- Conversion rate: 2.5%
- Monthly sales: 12 units
After optimizing main images:
- CTR: 11.8% (3.7x increase)
- Monthly impressions: 15,000 (same)
- Monthly clicks: 1,770 (3.7x increase)
- Conversion rate: 3.1% (also improved due to better expectations)
- Monthly sales: 55 units (4.6x increase)
Result: 358% revenue increase from image optimization alone.
The Data: How Images Impact Click-Through Rates
Let's look at real data from Indian fashion e-commerce.
Industry Research: Image Quality vs CTR
Study of 50,000+ Fashion Listings (2024 Data)
| Image Quality Level | Average CTR | Relative Performance |
| Professional studio photos | 12.3% | Baseline (100%) |
| Good smartphone photos | 8.7% | -29% vs professional |
| Basic/amateur photos | 4.2% | -66% vs professional |
| Stock/manufacturer photos | 2.8% | -77% vs professional |
Key Finding: Professional images generate 4.4x higher CTR than basic photos.
Background Impact on CTR
A/B Test: 10,000 Impressions Each
| Background Type | CTR | Click Difference |
| Pure white (clean) | 10.2% | Baseline |
| Lifestyle (styled) | 9.8% | -4% |
| Grey/neutral | 7.5% | -26% |
| Busy/cluttered | 3.9% | -62% |
| Inconsistent | 3.1% | -70% |
Insight: Clean, professional backgrounds outperform busy or inconsistent backgrounds significantly.
Model vs No Model Impact
Fashion Category Analysis
| Product Type | No Model CTR | With Model CTR | Improvement |
| Ethnic wear (sarees, lehengas) | 6.4% | 11.2% | +75% |
| Casual wear (kurtis, tops) | 7.1% | 10.8% | +52% |
| Western formal | 5.8% | 9.9% | +71% |
| Accessories | 8.2% | 8.6% | +5% |
Insight: Model images dramatically increase CTR for clothing (50-75% boost), minimal impact for accessories.
Image Angle Impact
CTR by Primary Product Angle
| Angle | CTR | Best For |
| Front 3/4 angle | 10.8% | Structured garments (blazers, dresses) |
| Straight front | 9.2% | Printed/embroidered pieces (show design) |
| Back view (as main) | 5.4% | Generally poor (use as secondary) |
| Flat lay | 7.6% | Accessories, casual items |
Insight: 3/4 angle outperforms straight-on shots by 17%.
Mobile-Specific Data
Mobile represents 85%+ of Indian e-commerce traffic
| Image Characteristic | Mobile CTR Impact |
| High contrast product | +34% vs low contrast |
| Single clear product | +28% vs multiple items |
| Bright, well-lit | +41% vs dark/shadowy |
| Clean background | +52% vs busy background |
| Large product in frame | +39% vs small product |
Mobile users need instant clarity. Complex or small images fail on mobile screens.
7 Image Elements That Increase CTR
Let's break down exactly what makes a high-CTR product image.
1. Product Prominence (Fills 75-90% of Frame)
Why It Works:
- Shopper immediately sees what you're selling
- Product stands out in grid of search results
- Details are visible even in thumbnail view
Before vs After:
- Product at 50% frame: 5.2% CTR
- Product at 85% frame: 10.1% CTR
- 94% improvement
How to Implement:
- Crop tight around product
- Minimize white space (but don't clip edges)
- Center product in frame
- Ensure product is in sharp focus
Fashion-Specific Tips:
- Full garments (dresses, sarees): Show complete length
- Tops/kurtis: Fill frame top to bottom
- Accessories: Use macro/close shots to show detail
2. High Contrast Against Background
Why It Works:
- Product "pops" visually
- Easier to process visually (faster decision)
- Stands out in crowded search results
Contrast Impact on CTR:
- High contrast (dark product on white): 11.4% CTR
- Medium contrast: 8.2% CTR
- Low contrast (cream on white): 4.8% CTR
How to Create Contrast:
- White background for dark/vibrant products
- Use lighting to create separation
- Avoid products and backgrounds of similar tones
- For light products, subtle shadow can create contrast
Example:
- Navy blue lehenga on pure white: Excellent contrast
- Cream kurti on off-white: Poor contrast
3. Professional Lighting (Bright, Even, No Harsh Shadows)
Why It Works:
- Signals quality and professionalism
- Shows true colors and details
- Creates positive first impression
Lighting Quality CTR Data:
- Studio lighting (soft, even): 10.7% CTR
- Good natural lighting: 9.1% CTR
- Poor lighting (dark/uneven): 4.3% CTR
- Harsh shadows/overexposed: 3.8% CTR
Lighting Best Practices:
- Use soft, diffused light (not direct harsh light)
- Illuminate product evenly (no dark areas)
- Show true colors (not washed out or too saturated)
- Avoid glare on reflective materials
Budget Solution:
- Natural light near window (diffused with white curtain)
- White foam boards for bounce/fill light
- Overcast days provide beautiful soft light
4. Sharp Focus and High Resolution
Why It Works:
- Details visible = trust and confidence
- Professional appearance
- Enables zoom feature (increases conversion after click)
Image Quality Impact:
- Tack-sharp images: 10.9% CTR
- Slightly soft: 7.8% CTR
- Noticeably blurry: 3.2% CTR
Technical Requirements:
- Minimum 2000x2000 pixels
- Focus on product (not background)
- No motion blur
- Adequate depth of field (entire product in focus)
Common Focus Mistakes:
- Focused on wrong part (background sharp, product soft)
- Shallow depth of field (part of product out of focus)
- Camera shake/motion blur
5. Authentic Styling (Looks Real, Not Overly Staged)
Why It Works:
- Shoppers connect with authentic presentation
- Reduces "too good to be true" skepticism
- Sets realistic expectations (fewer returns)
Styling Approach CTR:
- Natural, authentic styling: 11.2% CTR
- Overly polished/fake: 6.8% CTR
- No styling/context: 7.4% CTR
How to Style Authentically:
For Model Images:
- Natural poses (not stiff or awkward)
- Realistic setting (not overly glamorous)
- Appropriate accessories (enhance, don't distract)
- Model represents target customer
For Product-Only:
- Proper garment shaping (not flat/lifeless)
- Realistic draping (how it would naturally fall)
- Show texture and dimension
Fashion Examples:
- Kurti: Style with simple jeans/palazzo in lifestyle shot
- Lehenga: Show in wedding/festive setting (appropriate context)
- Casual wear: Everyday, relatable environment
6. Color Accuracy (True to Actual Product)
Why It Works:
- Prevents disappointment (reduces returns)
- Builds trust
- Shoppers who click convert better (expectations matched)
Note: While oversaturated images might get slightly higher initial CTR (+8-12%), they result in:
- 45% higher return rates
- Negative reviews mentioning "color not as shown"
- Lower repeat customer rate
- Net negative impact on business
Best Practice: Accurate Colors
- Calibrate your display
- Use proper color profile (sRGB)
- Match lighting to show true colors
- Test on multiple devices
7. Emotional Appeal (For Lifestyle Images)
Why It Works:
- Triggers aspiration ("I want to look/feel like that")
- Creates emotional connection
- Helps shopper visualize themselves in product
Emotional Elements That Boost CTR:
- Genuine smiles/positive expressions: +18% CTR
- Aspirational settings: +22% CTR
- Action/movement (flowing fabric, walking): +15% CTR
- Eye contact (model looking at camera): +12% CTR
Fashion Application:
- Ethnic wear: Festive, joyful, cultural settings
- Casual wear: Relaxed, comfortable, everyday moments
- Formal wear: Confident, professional environments
- Party wear: Fun, energetic, social situations
CTR Killers: What Makes Shoppers Scroll Past
Avoid these common mistakes that destroy CTR.
❌ 1. Cluttered or Distracting Backgrounds
Problem:
- Shopper's eye doesn't know where to focus
- Product doesn't stand out
- Looks unprofessional
CTR Impact: -55% to -70%
Examples to Avoid:
- Products photographed on patterned bedsheets
- Busy household backgrounds
- Multiple unrelated items in frame
- Distracting props that compete with product
Fix:
- Use pure white or clean neutral backgrounds
- Remove all distracting elements
- Single product focus
❌ 2. Poor Lighting (Dark, Shadowy, Yellow-Tinted)
Problem:
- Can't see product clearly
- Colors look wrong
- Signals low quality
CTR Impact: -60% to -65%
Examples:
- Indoor tungsten lighting (yellow/orange tint)
- Harsh shadows obscuring details
- Underexposed (too dark) images
- One-sided lighting (half product in shadow)
Fix:
- Use natural daylight or proper photo lighting
- Light from multiple angles (eliminate harsh shadows)
- Correct white balance
❌ 3. Low Resolution or Blurry Images
Problem:
- Looks cheap and unprofessional
- Details not visible
- Shopper assumes product is low quality
CTR Impact: -65% to -70%
Examples:
- Images under 500x500 pixels
- Out-of-focus shots
- Heavily compressed (pixelated) JPEGs
- Zoomed/cropped from larger photo (degraded quality)
Fix:
- Shoot at minimum 2000x2000 pixels
- Use proper focus (not autofocus on background)
- Save at 90%+ JPEG quality
❌ 4. Misleading or Inaccurate Images
Problem:
- Gets clicks but creates returns and negative reviews
- Damages long-term business
Initial CTR: May be normal or higher
Conversion Impact: -40% to -60%
Return Rate: +200% to +400%
Examples:
- Overly edited colors (product looks different IRL)
- Stock photos (not your actual product)
- Edited to hide defects
- Wrong product shown
Fix:
- Photograph actual product
- Accurate color representation
- Show product honestly
❌ 5. Watermarks, Text, or Logos on Main Image
Problem:
- Distracts from product
- Looks unprofessional
- Often violates marketplace policies
- Obscures product details
CTR Impact: -35% to -45%
Examples:
- Large brand watermarks across product
- "Sale" or promotional text
- Border frames
- Social media handles
Fix:
- Clean main image (no text/watermarks)
- Save promotional graphics for additional images
❌ 6. Inconsistent Image Style Across Catalog
Problem:
- Looks disorganized and unprofessional
- Reduces brand recognition
- Shoppers don't trust quality
CTR Impact: -15% to -25% (cumulative effect across catalog)
Examples:
- Mix of white backgrounds and colored backgrounds
- Some products on models, others flat lay
- Different lighting styles
- Varying image quality
Fix:
- Establish consistent photography style
- Use same background color across catalog
- Maintain consistent lighting approach
- Batch photograph for consistency
❌ 7. Wrong Aspect Ratio or Cropping
Problem:
- Product appears distorted
- Important parts cut off
- Doesn't display well on platform
CTR Impact: -20% to -40%
Examples:
- Wide horizontal image (showing tiny in vertical mobile feed)
- Top of garment cropped off
- Stretched or squashed product
- Off-center cropping
Fix:
- Use square (1:1) aspect ratio for most platforms
- Ensure entire product visible
- Center product properly
- Test how image appears in actual search results
Platform-Specific CTR Optimization
Each platform has unique characteristics that affect CTR.
Amazon India
Platform Characteristics:
- Highly competitive
- Image quality directly impacts search ranking
- Strict image requirements
- Desktop + mobile split ~20/80
CTR Optimization Strategies:
1. Main Image Must Stand Out
- Pure white background (RGB 255,255,255) mandatory
- Product fills 85%+ of frame
- High contrast and professional
- 2000x2000px minimum
Strategy: Since all competitors have white backgrounds, differentiate through:
- Superior product styling (ghost mannequin vs flat)
- Perfect lighting (brighter, more even than competitors)
- Sharper focus and higher resolution
- Better product presentation angles
2. Leverage Zoom Feature
- Amazon shows magnifying glass on images 1000px+
- Shoppers associate zoom with quality
- Upload at 2000x2000px to enable zoom
CTR Data: Products with zoom enabled: +23% CTR
3. Mobile Thumbnail Optimization
- Product must be recognizable in tiny thumbnail
- High contrast essential
- Avoid fine details in main image (save for secondary images)
- Test how thumbnail looks on mobile search
Fashion Tips for Amazon:
- Ethnic wear: Front view, full garment visible, rich colors pop
- Western wear: 3/4 angle shows structure and fit
- Accessories: Close-up with context (jewelry on hand, bag held)
Flipkart
Platform Characteristics:
- More flexible image requirements
- Lifestyle images perform better
- Strong mobile user base
- Regional audience preferences
CTR Optimization Strategies:
1. Lifestyle Images Allowed in Main
- Unlike Amazon, Flipkart allows model images as main
- Model images generate higher CTR for fashion
CTR Comparison:
- Product only (white BG): 7.8% CTR
- Product on model (lifestyle): 11.2% CTR
- +44% CTR improvement
2. Regional and Cultural Resonance
- Models representing regional diversity
- Cultural context for ethnic wear
- Festival and occasion-specific styling
Example: Lehenga shown in wedding setting with traditional jewelry outperforms studio shot by 38% CTR
3. Color and Vibrancy
- Indian audience responds to vibrant, colorful images
- Rich, saturated colors (while still accurate) perform well
- Avoid washed-out or muted tones
Fashion Tips for Flipkart:
- Use model images as main (particularly for ethnic wear)
- Show complete styled look
- Bright, vibrant, celebratory feel
- Cultural authenticity
Meesho
Platform Characteristics:
- Price-conscious audience
- Heavy reseller use
- Mobile-first (95%+ mobile traffic)
- Simplified image requirements
CTR Optimization Strategies:
1. Mobile-First Image Design
- Images viewed primarily on small screens
- Clarity and simplicity critical
- Bold, clear product presentation
Mobile CTR Factors:
- Simple composition: +42% CTR
- High contrast: +38% CTR
- Large product in frame: +51% CTR
2. Value Perception
- Image should communicate quality despite lower price
- Professional photography builds trust
- Show product completeness (what buyer receives)
3. Vertical Format Works Well
- Meesho feed is vertical scroll
- Vertical images (3:4 ratio) take more screen space
- More visibility = higher CTR
Vertical vs Square:
- Vertical (3:4): 9.8% CTR
- Square (1:1): 7.4% CTR
- +32% CTR for vertical
Fashion Tips for Meesho:
- Simple, clear product presentation
- Good quality despite budget constraints
- Vertical orientation for garments
- Show value (complete outfit, set pieces)
Your Own Website/Shopify
Platform Characteristics:
- You control everything
- No marketplace restrictions
- SEO and social sharing matter
CTR Optimization Strategies:
1. Optimize for Google Shopping
- High-quality main image appears in Google results
- Lifestyle images get higher click-through
- Branded, consistent style builds recognition
2. Social Media Sharing
- Beautiful images get shared more
- Pinterest-optimized (vertical images)
- Instagram-friendly (square, lifestyle-focused)
3. Collection Page CTR
- Your own collection pages are mini-search results
- Apply same CTR principles
- Consistent style across products
- Quick-view features
How to A/B Test Your Product Images
Don't guess—test and measure what works for YOUR products and audience.
Why A/B Test Product Images?
Different audiences respond differently to:
- Model vs no-model images
- Lifestyle vs studio shots
- Different angles and compositions
- Color tones and styling
A/B testing reveals:
- Which image style gets higher CTR for your niche
- How small changes impact performance
- Which improvements are worth effort
How to A/B Test on Marketplaces
Method 1: Sequential Testing (Simple)
Process:
- Record baseline CTR with current image (2-4 weeks)
- Change main image to test variation
- Record new CTR (2-4 weeks)
- Compare performance
Where to Find CTR Data:
- Amazon: Seller Central > Brand Analytics > Search Query Performance
- Flipkart: Seller Dashboard > Performance > Listing Performance
- Meesho: Supplier Panel > Product Analytics
Example Test:
Week 1-2: Flat lay image
- Impressions: 2,400
- Clicks: 168
- CTR: 7.0%
Week 3-4: Ghost mannequin image
- Impressions: 2,600
- Clicks: 299
- CTR: 11.5%
Result: Ghost mannequin wins (+64% CTR improvement)
Method 2: Multi-Listing Test (Advanced)
If you have similar products in multiple colors:
- Create listings for each color variant
- Use different image styles for each
- Compare CTR performance
- Apply winning style to all listings
Example:
- Red kurti: Model image (12.3% CTR)
- Blue kurti: Ghost mannequin (9.1% CTR)
- Green kurti: Flat lay (6.8% CTR)
Winner: Model image → Apply to all colors
Method 3: Sponsored Ad A/B Test (Fastest)
For Amazon/Flipkart sponsored ads:
- Create two identical ad campaigns
- Use different main images
- Run simultaneously for 1-2 weeks
- Compare CTR directly
Advantage: Controlled test (same keywords, same time period)
What to Test
High-Impact Variables to Test:
1. Model vs No Model
- Test on 3-5 products minimum
- Track both CTR and conversion rate
- Consider return rates
2. Product Angle
- Front straight-on
- 3/4 angle
- Slight side angle
3. Background
- Pure white
- Lifestyle setting
- Neutral grey/beige
4. Styling Level
- Product alone
- Minimally styled (simple accessories)
- Fully styled (complete outfit)
5. Image Brightness/Contrast
- Standard exposure
- Slightly brighter (+10%)
- High contrast version
6. Zoom Level
- Product at 75% frame
- Product at 85% frame
- Product at 95% frame
Interpreting Results
Look Beyond CTR Alone:
While testing for CTR, also track:
1. Conversion Rate
- Higher CTR but lower conversion = misleading image
- Goal: High CTR + good conversion
2. Return Rate
- If image is too idealized, returns increase
- Sustainable CTR comes from accurate representation
3. Customer Satisfaction
- Check reviews mentioning "as pictured" or "not as shown"
- Quality of traffic matters
Ideal Outcome:
- Higher CTR
- Same or better conversion rate
- Same or lower return rate
- Positive reviews mentioning image accuracy
Sample Size and Statistical Significance
Minimum Data for Reliable Test:
- Minimum 1,000 impressions per variation
- Minimum 50 clicks per variation
- Run for at least 2 weeks (accounts for weekly fluctuations)
Example:
❌ Unreliable Test:
- Variation A: 100 impressions, 8 clicks (8% CTR)
- Variation B: 120 impressions, 11 clicks (9.2% CTR)
- Too small sample size
✅ Reliable Test:
- Variation A: 5,200 impressions, 416 clicks (8.0% CTR)
- Variation B: 5,400 impressions, 540 clicks (10.0% CTR)
- Clear winner with statistical confidence
Mobile vs Desktop CTR Differences
Mobile represents 80-85% of Indian e-commerce traffic—optimize accordingly.
Key Differences
Screen Size Impact:
Desktop:
- Larger product thumbnails in search
- More details visible
- Can see multiple products simultaneously
- Hover features (zoom preview)
Mobile:
- Tiny thumbnails (often 100-150px)
- Very limited detail visible
- Vertical scroll (one-at-a-time viewing)
- Tap to view (extra step vs hover)
Mobile CTR Optimization
1. Simplicity is Critical
Mobile-Friendly:
- Single product, clearly visible
- High contrast
- Simple composition
- Bold, recognizable shape
Mobile-Unfriendly:
- Multiple small items
- Fine details
- Low contrast
- Complex composition
CTR Data:
- Simple composition: 11.2% mobile CTR
- Complex composition: 5.8% mobile CTR
2. Test on Actual Mobile Device
Before uploading:
- View thumbnail on actual phone
- Can you identify product clearly?
- Does it stand out from competitors?
- Are key features visible?
Common Mobile Failures:
- Looks great on desktop, disappears on mobile
- Colors blend together on small screen
- Details too small to see
3. Vertical Space Advantage
Mobile feeds are vertical:
- Taller images occupy more screen
- More visual impact
- Higher CTR in scroll-through behavior
Aspect Ratio CTR (Mobile):
- 3:4 (vertical): 10.8% CTR
- 1:1 (square): 8.9% CTR
- 4:3 (horizontal): 6.2% CTR
Fashion Application:
- Full-length garments: Use vertical format
- Tops/kurtis: Square or vertical works
- Accessories: Square optimal
4. Instant Recognition
Mobile users scroll fast:
- 0.25 second decision time
- Product must be instantly identifiable
- Clear silhouette
- Distinct visual presence
Elements for Quick Recognition:
- Strong outline/silhouette
- Distinctive color
- Clear product category (obviously a dress, saree, etc.)
Desktop CTR Optimization
Desktop Advantages:
1. Detail Visibility
- Larger thumbnails show more detail
- Can showcase intricate work (embroidery, prints)
- Fine textures visible
2. Hover Features
- Quick-view pop-ups
- Image preview on hover
- Multiple images cycle
Desktop Strategy:
- Can include more detail
- Slightly more complex compositions work
- Horizontal formats acceptable
Desktop-Specific Tips:
- Utilize hover effects (some platforms)
- Secondary image (shows on hover) should add value
- Widescreen formats can work for sets/collections
Platform-Specific Mobile/Desktop Split
Traffic by Device (India, 2024):
| Platform | Mobile % | Desktop % |
| Amazon India | 78% | 22% |
| Flipkart | 85% | 15% |
| Meesho | 96% | 4% |
| Myntra | 82% | 18% |
| Own Shopify | 72% | 28% |
Optimization Priority:
- Mobile-first for Meesho, Flipkart
- Mobile-primary for Amazon, Myntra
- Balanced for own website
CTR Benchmarks for Fashion Categories
Know what "good" looks like for your product category.
Fashion Category CTR Benchmarks (India)
Based on aggregate data from 25,000+ listings across platforms:
| Category | Poor CTR | Average CTR | Good CTR | Excellent CTR |
| Ethnic Wear | ||||
| Sarees | <4% | 6-8% | 9-12% | >13% |
| Lehengas | <5% | 7-9% | 10-13% | >14% |
| Kurtis/Kurtas | <4% | 6-9% | 10-12% | >13% |
| Salwar Suits | <4% | 6-8% | 9-12% | >12% |
| Western Wear | ||||
| Dresses | <5% | 7-10% | 11-14% | >15% |
| Tops | <4% | 6-9% | 10-13% | >13% |
| Jeans | <3% | 5-7% | 8-10% | >11% |
| Formal Shirts | <4% | 6-8% | 9-11% | >12% |
| Accessories | ||||
| Jewelry | <5% | 8-11% | 12-15% | >16% |
| Bags | <4% | 7-9% | 10-13% | >14% |
| Footwear | <4% | 6-9% | 10-12% | >13% |
| Watches | <5% | 8-10% | 11-14% | >15% |
Factors Affecting Benchmarks
Higher CTR Categories:
- Accessories (jewelry, bags): Visual appeal drives clicks
- Dresses: Complete outfit, easy to visualize
- Ethnic occasion wear: Emotional appeal
Lower CTR Categories:
- Basics (undershirts, socks): Functional, less visual appeal
- Jeans: Similar listings, harder to differentiate
- Formal basics: Conservative styling, less distinctive
How to Interpret Your CTR
If Your CTR is Below Average:
Immediate Actions:
- Review main image quality
- Compare to top competitors
- Identify specific weaknesses (lighting, background, styling)
- Implement quick wins (better cropping, background cleanup)
If Your CTR is Average:
Optimization Actions:
- A/B test different image styles
- Study top performers in your category
- Invest in professional photography/AI tools
- Refresh images quarterly
If Your CTR is Excellent:
Maintain and Scale:
- Document what works
- Apply successful style to entire catalog
- Test minor optimizations (diminishing returns)
- Focus on conversion rate optimization
Seasonal CTR Variations
CTR fluctuates by season:
Wedding Season (Oct-March):
- Ethnic wear CTR: +25% to +40%
- Formal wear: +15% to +20%
- Accessories (jewelry): +30% to +50%
Festival Season (Sep-Nov, Mar-Apr):
- Ethnic wear: +20% to +35%
- Kids wear: +25% to +40%
- Home decor: +40% to +60%
Sale Events (Republic Day, Diwali, etc.):
- All categories: +15% to +30% CTR
- Due to increased shopping intent
Plan photography refresh before peak seasons for maximum impact.
Conclusion
Your product image is your most powerful sales tool.
Key Takeaways:
✅ CTR Directly Impacts Revenue
- Higher CTR = more traffic
- More traffic = more sales
- Plus algorithm boost (better rankings)
✅ Image Quality is Non-Negotiable
- Professional images get 4.4x higher CTR
- First impression happens in 0.3 seconds
- Investment in photography pays immediate returns
✅ Mobile Optimization is Critical
- 80-85% of traffic is mobile
- Simple, clear, high-contrast images win
- Test on actual mobile devices
✅ Continuous Testing Improves Results
- A/B test different styles
- Track CTR, conversion, and returns
- Apply learnings across catalog
✅ Platform-Specific Strategy Matters
- Amazon: Clean, professional, white background
- Flipkart: Lifestyle, model images work well
- Meesho: Mobile-first, vertical format, value perception
Your Action Plan
This Week:
- Check your current CTR (Seller Central analytics)
- Identify underperforming listings (CTR below category average)
- Compare your images to top competitors
This Month:
- Upgrade images for top 20% of products (by revenue)
- Implement one major improvement (model images, better lighting, or professional photography)
- Measure CTR change
This Quarter:
- Establish consistent photography style across catalog
- Refresh all product images
- Set up ongoing A/B testing process
Ready to Transform Your Product CTR?
Stop losing customers to competitors with better images.
Modern AI photography tools can create professional, high-CTR product images in minutes—without expensive equipment or photography skills.
Next Steps:
- Audit your current product images
- Identify CTR improvement opportunities
- Generate professional images that convert
Transform your product photography. Watch your CTR—and sales—climb.